Yield Prediction Using Satellite Data and Machine Learning
October 26, 2023

Efficient water resource management in agriculture is a critical challenge, especially in the face of climate change and increasing freshwater demand. This article explores the technical aspects of a system designed to optimize agricultural practices by leveraging satellite data and machine learning models to predict crop yields. The system integrates environmental sensors, satellite imagery, and advanced data processing techniques to provide actionable insights for farmers.
System Architecture Overview
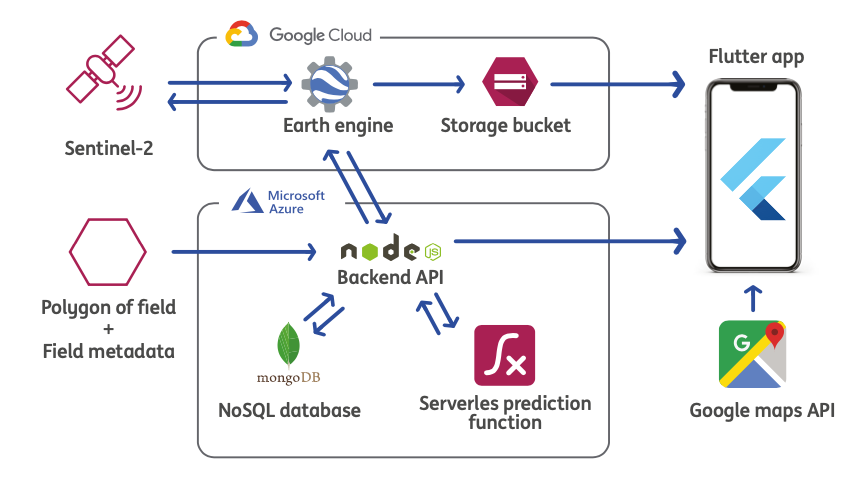
The system architecture is built around the integration of satellite data, environmental indices, and machine learning models. At its core, the system utilizes Google Earth Engine (GEE) for processing satellite imagery and extracting key environmental indices. These indices are then used to analyze soil moisture, vegetation health, and other critical factors that influence crop yield.
The backend of the system is developed using Node.js, which serves as the intermediary between the satellite data processing pipeline and the app interface. The app, built using Flutter, provides real-time analytics and visualizations to end-users, enabling informed decision-making in agricultural management.
Leveraging Google Earth Engine for Soil Information Extraction
Google Earth Engine is a powerful cloud-based platform for geospatial analysis, offering access to a vast repository of satellite imagery and geospatial datasets. In this project, GEE was utilized to extract soil and vegetation information by computing environmental indices such as:
1. Normalized Difference Vegetation Index (NDVI)
NDVI is a widely used index for assessing vegetation health. It is calculated using the reflectance values of near-infrared (NIR) and red light bands:
NDVI = (NIR - Red) / (NIR + Red)Higher NDVI values indicate healthier vegetation, which is crucial for predicting crop yields.
2. Normalized Difference Water Index (NDWI)
NDWI is used to monitor water content in vegetation and soil. It is computed using the green and NIR bands:
NDWI = (Green - NIR) / (Green + NIR)This index helps in assessing soil moisture levels, which are vital for irrigation planning.
3. Enhanced Vegetation Index (EVI)
EVI improves upon NDVI by reducing atmospheric influences and accounting for canopy background signals. It is calculated as:
EVI = G * (NIR - Red) / (NIR + C₁ * Red - C₂ * Blue + L)where G is the gain factor, C₁ and C₂ are coefficients for aerosol resistance, and L is the canopy background adjustment.
These indices were computed using satellite imagery from platforms such as Sentinel-2 and Landsat, which provide high-resolution data suitable for agricultural analysis. The processing pipeline in GEE involved filtering images based on cloud cover, selecting relevant spectral bands, and applying mathematical operations to derive the indices.
Data Processing and Analysis
The extracted indices were further processed to generate actionable insights. This involved:
- Temporal Analysis: Satellite data was analyzed over time to identify trends in vegetation health and soil moisture. This temporal analysis helped in understanding seasonal variations and predicting potential crop yields.
- Spatial Analysis: Spatial patterns of soil moisture and vegetation health were mapped to identify areas requiring intervention. This spatial analysis was critical for optimizing irrigation and resource allocation.
- Machine Learning Integration: The processed data was fed into machine learning models to predict crop yields. The ML4EARTH HACKATHON dataset was used for training and validating these models. Techniques such as feature engineering, dimensionality reduction, and hyperparameter tuning were employed to improve model accuracy.
Backend and App Integration
The backend, developed in Node.js, acted as the central hub for data processing and communication. It interfaced with GEE to retrieve satellite data, processed the data to compute indices, and stored the results in a database. The backend also provided APIs for the Flutter-based app, enabling real-time data visualization and analytics.
The app was designed to be user-friendly, offering farmers insights into field conditions and crop yield predictions. Key features included:
- Interactive maps displaying soil moisture and vegetation health.
- Graphs showing temporal trends in environmental indices.
- Recommendations for irrigation and resource management based on predictive analytics.
Conclusion
This system represents a significant advancement in agricultural management by integrating satellite data, environmental indices, and machine learning models. The use of Google Earth Engine for soil information extraction ensures accurate and scalable analysis, while the backend and app provide a seamless interface for end-users. By leveraging these technologies, the system offers a data-driven approach to optimizing water resource use and enhancing crop yields, addressing the challenges posed by climate change and increasing freshwater demand.